Last year, I wrote a blog entitled ‘Why I don’t like spreadsheets’ and I was amazed at the response I received around it. When I wrote it, I thought it might have been quite divisive – I know there are some people out there who love a spreadsheet, however many people have said to me that they feel the same.
I have just been inspired to follow up with this blog on why I am even more of the belief that although the odd spreadsheet has its place, we should be using them less often.
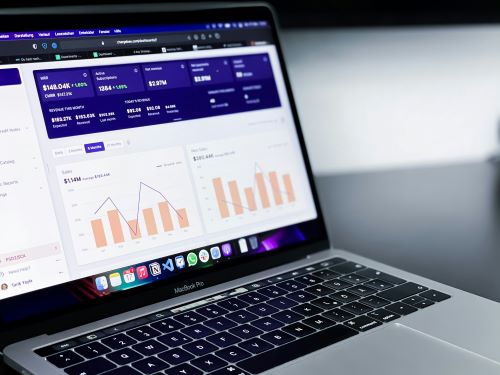
So what inspired this blog? Well, I’m just out of a session that our new Principal of Strathclyde, Stephen McArthur was holding for all staff. He gave an update and he mentioned some of the new things that he has put in place since he became Principal on 1st September 2025.. It was one of the more minor things he mentioned that struck me. We can make use of the new technologies that are readily available to all of us and, where possible, replace spreadsheets with dashboards! Can I say – I told you so?
 A number of years ago, I was working on a project – actually the first one I ever worked on. It was well over ten years ago and it still sticks in my mind! During the project, I came across someone who had a spreadsheet - a massive one. I think if it was printed, it would have been 26 pages. The spreadsheet itself was created from a download of information from a university system that tracked applicants to different courses. It was created for this one course, and was then updated every single time a new person submitted an application, or accepted an offer, or anything else changed on the application. It was a job in itself to update this spreadsheet and keep it current. The thing is – this person was probably one of many doing this type of thing.
I’m not criticising this spreadsheet at all. Far from it, at the time, it was helping a department keep on top of applications. But we are not there anymore, we are in a position where we can analyse information at the click of a button pulling the report directly from a system into Power BI and create a dashboard that can be automatically set to update whenever it is required.
Like I said, spreadsheets can have their place, but in reality, for me anyway, they are out of date very quickly, they are also very static and not very interactive. Dashboards on the other hand are a completely different story. They are interactive, up to date and so much more than a spreadsheet.
I helped a colleague who was using a spreadsheet to run user acceptance testing (UAT) for a project, to transition it to a SharePoint List and an interactive dashboard. The large spreadsheet was unwieldy and was tricky to report on, but the dashboard was a gamechanger for them and others involved in UAT. Even some of the senior stakeholders were regularly using the dashboard to ask questions about testing and understand where UAT was at. Everyone with a link to the dashboard was able to see the status of all the tests, see what areas needed to be targeted, and show how close UAT was to completion. It even reduced the stress levels of my colleague somewhat!
If you would like to learn more about using a Power BI dashboard or would like to see what others have used, we have many examples across the University of what you can create, as well as an online, on-demand training for Power BI Beginners. This is available for all University staff, as is our Power Platform Hub within the CI Directorate SharePoint site.
If you work outside of the University and would like to find out more, please contact us via email.


