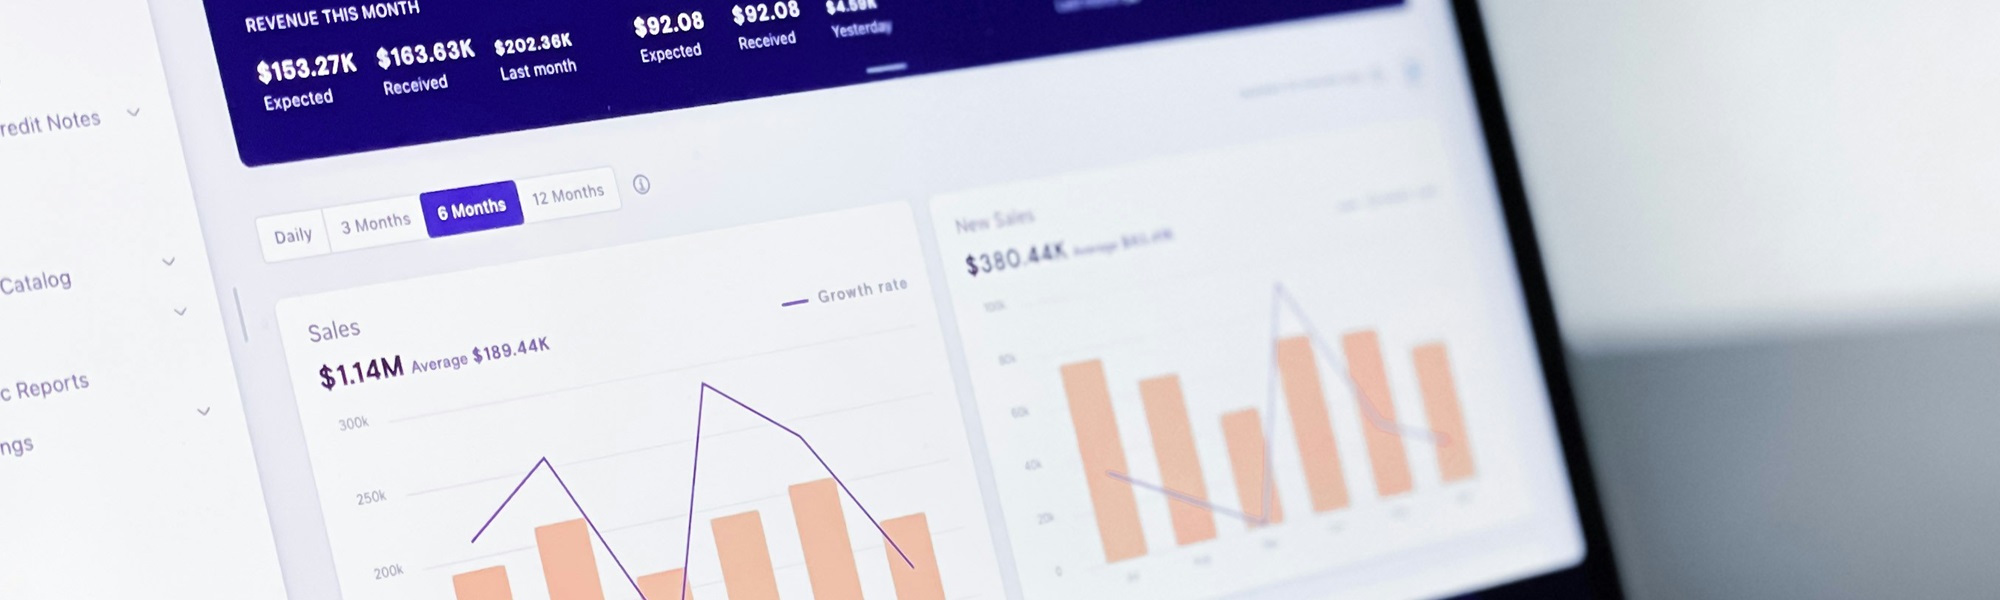
Often, when people think of a Power BI dashboard full of graphs and tables, it is a report. Something that shows you the current picture. In many ways, this is what a dashboard is. I think it is a lot more than that. To me, a dashboard is something that can:
- Drive actions
- Provide a full picture
- Enable discussions
- Replace papers or agendas
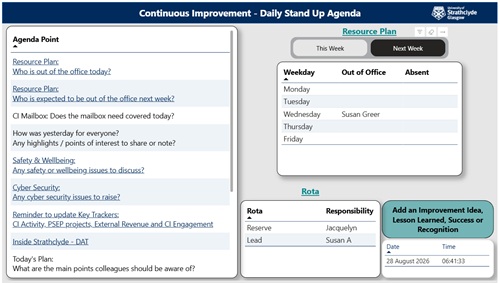 More and more in our team, we are using dashboards in many different ways. At the start of each day, we have a 10 minute Daily Stand Up meeting (maybe should think about changing the name of this since no one is actually standing up anymore). We have a meeting agenda that we follow and it has links to other things (like Planner or a SharePoint List) to aid the discussion. The agenda is a Power BI dashboard – not something that I would ever have thought of, but it works well. It actually works so well that the agenda differs slightly each day to suit our needs. For example, on a Tuesday, we have a slightly longer meeting where we go into more detail about our projects, so the agenda includes this. We talk about blogs once a week, or on a Thursday, we ensure our record of training participants is up to date. I could go on, but you get the point, the dashboard enables our meeting to work the way we want it to and to tailor it to daily needs.
Another use for a dashboard is when it is used as a tracker of progress. I put a Power BI dashboard together a couple of years ago for a colleague who was running User Acceptance Training (UAT) for a system implementation project. The UAT log was a massive spreadsheet with lots of details about each test – what the test was, what the result was, who performed the test, the date of the test – again, I am sure you get the picture. There were thousands of lines on the log as well as many different tabs where there were different pivot tables and charts looking to show the status of UAT. A graph to show the number of tests for each process, another graph showing how many tests had failed – lots and lots of graphs. It was taking up a lot of time to get the understanding of how UAT was doing. I turned this into a Power BI dashboard with 3-4 different views that showed the whole picture of where UAT was at. Being able to interact with the graphs and tables made it much easier to keep on top of the testing. It was also easier to demonstrate the overall picture to others. A link to a dashboard that could easily be refreshed was more useful than a report with graphs cut and pasted from excel. One of my favourite things about the dashboard was that it enabled targeted actions to be taken. Where one process had a lot of outstanding tests, it meant that these could be focused on. Ultimately, it gave my colleague reassurance that he was targeting the right things, that he could see the full picture and gave him confidence to make decisions. It definitely saved him time and effort.
Using a dashboard to report to a project board or meeting is also really powerful. Working on a recent project has meant that I have gotten very familiar with creating dashboards. I find myself thinking – a dashboard would work for that! A lot of the time. I attend a project board and give an update. For a couple of months there, I was giving an update that was submitted a week before the meeting, then at the meeting, providing a verbal update of the position. I felt like I was throwing numbers at people and expecting them to take them in. Last meeting, I shared a link to two different dashboards, making it easy for me to share the current position, and making it much easier for the others attending to understand. They could see how things were rather than try and take in me spouting figures at them.
I could go on and on about how useful dashboards are, but I hope that I have already convinced you that they are the way to go. If you haven’t tried putting one together, or would like to know more, check out the CI SharePoint site for more information. I would encourage you to give it a go for yourself and create your own dashboard.