In my previous blogs I have showcased using a Benefits Exploration Map to consider how an improvement initiative helps to achieve the institution's strategic goals and what stakeholders stand to gain from engaging in the process, and using a Measurable Benefits Data Plan to drive the data capture required to evidence the impact of the initiative. This time I'm writing about using that data to demonstrate the need for change and gain the support of your stakeholders.
Don't tell me, show me
When it comes to demonstrating the need for change, I always ask myself what is the best way to communicate with my key stakeholders? I know that fundamentally I want to tell them a story, to build up a narrative based on the facts which unequivocally demonstrates the status quo is not good enough and compels them to engage with change. I don’t just want to tell them, I want to show them.
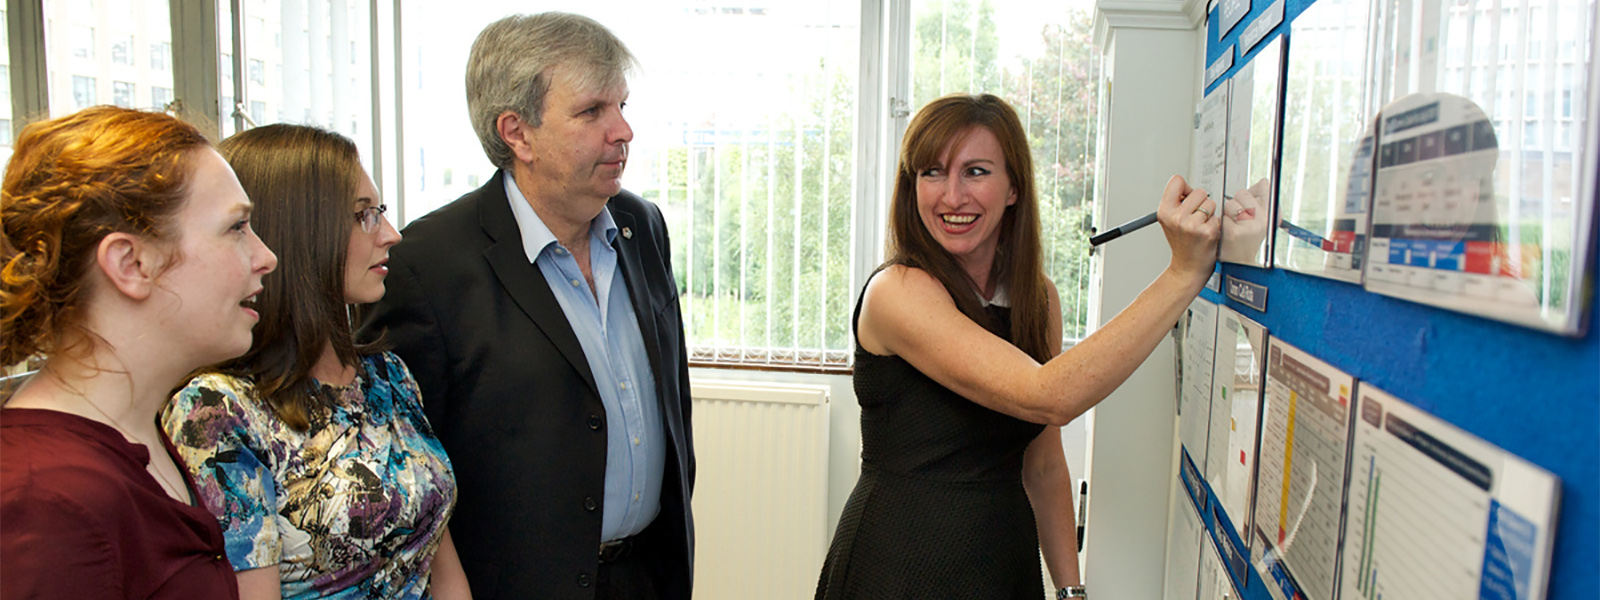
One of the most effective ways of doing this is to create a Data Wall. What is a Data Wall you ask? Let me show you...

A Data Wall is a physical space to visually display the evidence gathered about an improvement initiative. The Data Wall should be used for two purposes: to highlight the baseline data about the current condition to provide the impetus for change, and subsequently the data that clearly demonstrates the benefits gained from implementing improvements. A Data Wall does not include a process map, or the outputs of a brainstorming session to identify solutions, or a description of the improvements implemented. The focus is solely on data to evidence the need for change and the impact of change.
The example Data Wall is part of the Strathclyde Timetabling project showcasing the baseline data gathered. The evidence was collated by the Business Improvement Team in collaboration with the Timetabling Manager and Head of Space Planning during the project Scoping Phase (this activity was supported by using a Measurable Benefits Data Plan). The data is displayed visually, with the key findings outlining the challenges with the current condition and therefore, the need for change.
We’ve utilised the Data Wall in a range of scenarios where we are aiming to gain stakeholder support for, and engagement with, the initiative:
- Securing faculty commitment and nominations of project team members from senior faculty management during the early project scoping
- Setting the scene and highlighting the importance of the project team’s contributions during the first workshop
- Gathering improvement ideas from a cross-section of staff working on different parts of the process during a university-wide engagement session with over 40 attendees
- Providing context about the planned improvements and securing the commitment of senior stakeholders from all faculties to implement the new way of working
- Explaining our Evidencing Benefits approach to visitors from other institutions using real project information
Once the improvements have been implemented, the Timetabling Data Wall will be updated to include post-improvement data. Comparing the post-improvement data with the baseline data will demonstrate and quantify the benefits of the initiative. The narrative of the Timetabling project will then focus on the successes of the initiative and the impact the change has made to motivate all stakeholders to sustain the new way of working and pursue further improvements.
I hope this example above demonstrates how a Data Wall can help you communicate the story you want to tell and ultimately gain the support you require for the improvement initiative.
