Pareto analysis or the 80/20 rule is all about separating the “vital few” from the “trivial many”.
How much time do we spend on things that have very little impact on our lives and how much time do we spend on things that could have a massive impact?
You can work out the maths for yourself.
So wouldn't it be fantastic if there was a way to discover the things that could have a dramatic impact and then act on them.
The good news there is.
In 1896 an Italian economist called Vilfredo Pareto made an interesting discovery. He realised that 20% of the people in Italy owned 80% of the land. This phenomenon holds true in many aspects of life, and is often now referred to as the 80/20 rule.
- 20% of your clothes are worn 80% of the time
- 20% of your carpets get 80% of the wear
- 20% of criminals account for 80% of the crime
The list could go on and on.
The Pareto principle or 80/20 rule states that in many situations 20% of the inputs account for 80% of the outputs in any given situation.

Not to get too Zen about it, but this can have some implications:
What 20% of your possessions do you get the most value from?
Do I need all the other stuff?
What do you spend 20% of your time doing that gives you 80% of your fulfilment?
Could I do more of that?
What’s the 20% of food you eat 80% of the time?
Is that food good for me?
So how do you apply these ideas? How do we identify the vital few? Let’s go through an example:
Say we are working in the office and from time to time there are ‘errors’ that prevent work flowing through the system, first time, and require some sort of intervention.
Chronic errors like these normally lead to delays, disruption, backlogs of work, and general "frustration" within the workplace. In these situations, we often put a “band aid” on the problem and don’t get to the root cause.
Using a Pareto chart enables us to understand and identify the “vital few” issues.
Here are the steps ivolved:
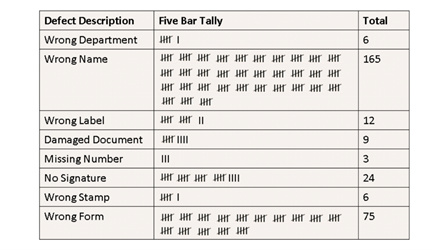
- Start by gathering the data about the problem you are investigating. You can use a 5-bar tally check sheet to do this.

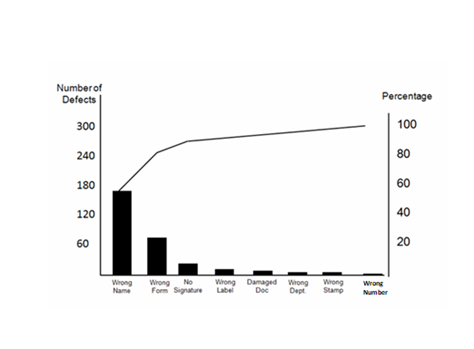
- Draw a bar chart showing the data. It can be useful to add a line showing the accumulated errors as a percentage. This helps in identifying the reasons that are contributing to 80% of the problems. Microsoft Excel has a Pareto Chart option available to aid doing this.

You can see from this chart that approximately 20% of the causes (Wrong name and Wrong form) account for 80% of the defects.
So in this example, if we can concentrate all our efforts on eliminating these two chronic errors then we can have a major impact on our overall process quality.
If you would like to delve a bit deeper into this topic then the book “The 80/20 Principle” by Richard Koch is an excellent reference.
So, in summary identifying the ‘Vital Few’ issues using the Pareto Principle, and then leveraging your resources to tackle them, can have a dramatic impact on your Continuous Improvement efforts. A very simple but effective technique.


