In this series of two blogs, I would like to share with you a structured way to run continuous improvement projects.
Introduction
When undertaking a Lean project I recommend using nine stages. By working through these stages in sequence, you greatly increase your chances of delivering a successful project.
Stage One - The Project Proposal
Start planning your project by asking the question “why?” and think about what was the situation that led you to need to do this project. What would happen if the project were not done? Who else would benefit from the outcomes of your project?
Other considerations are:
- Key deliverables
- Important stakeholders
- The scope and objectives
- Anticipated project benefits
- Getting a credible sponsor
At this stage, getting consensus around the scope and objectives for your project is critical.
The bottom line is if you are not clear on why you want to do the project, why should anyone else be?
Stage Two - Evidencing the Benefits
Many projects leaders are not able to prove the project benefits at the end of the project.
Do not let that be you.
It is important to get the potential benefits upfront before you commit any major resources to the project.
To do this use a Benefits Exploration Map (BEM), and a Measureable Benefits Data Plan (MBDP) to achieve this. Completing these identifies the benefits that could result from the change.
The four sections of the BEM relate to the different types of benefits delivered by the project:
Long Term Strategic Benefits
- Used to show alignment with the strategic priorities of the organisation
Observable and Behavioural Benefits
- Used to show observable benefits such as in improvements in behaviour and culture
Stakeholder Benefits
- Used to show the direct benefits for stakeholder groups
Measurable Benefits
- Used to detail the range of anticipated measurable benefits and show the impact of the project. What we can collect data on – before and after improvement
The measurable benefits are a key input to developing a measurable benefits data plan.
A measurable benefit should fall into one of these categories:
- Financial (cost saved, increased revenue, office space saved)
- Capacity (staff capacity savings, staff hours)
- Operational (lead time improvement, productivity, improved communication)
- Experience & Engagement (improved stakeholder experience, improved engagement, improved conversion rate)
- Quality (reduced calls/e-mails, reduced waste/rework/errors, increased compliance)
This provides a solid baseline to measure the impact of your project. A benefit is a positive impact achieved by delivering the change. Completing the BEM and the MBDP identifies the benefits that could result from the change.
Stage Three - The SIPOC
Having completed your BEM and MBDP, you should now be in a position to decide whether the project is viable or not. I hope that it is.
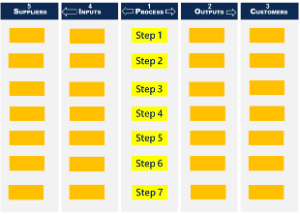
We are for the first time trying to get to grips with the current condition by creating a high-level map of the process called a SIPOC. I would always recommend that you “go and see” the process in action, before creating the SIPOC
SIPOC is an acronym of the words Suppliers, Inputs, Process, Output, and Customers.
- Supplier – person or organisation that provides input to a process
- Input – materials, resources or data required to execute the process
- Process – Series of steps where an input converts to an output – the products or services that result from the process
- Outputs - The products or services that result from the process
- Customers – The Person/ Organisation that receives the products or services
 The SIPOC chart takes a high-level view of the process. To work effectively the SIPOC should have a maximum of seven process steps.
Creating a SIPOC is a great way to get an overview of the process and to help identify the key players that are involved
Once you have completed your SIPOC then it is now time to get into a bit more detail by creating a process map.
Stage Four - The Current State Process Map
 We use a process map to communicate the process steps, identify wastes, bottlenecks, and generate opportunities for improvements.
We create a process map by doing the following:
- Use the SIPOC as a guide to identifying the main process steps (particular the start and end steps)
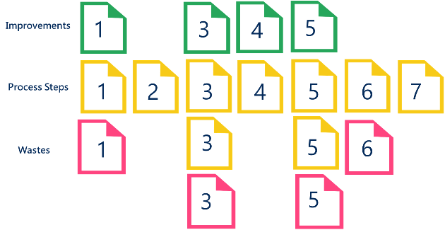
- Use a roll of brown paper and sticky notes to create the map (Use yellow for the process steps, pink for identified wastes and green for improvements ideas)
- Number the process steps once you are happy with them
- Check that the main steps from the SIPOC have been covered during process mapping
- Identify improvement opportunities and wastes/issues with the current process (ensuring that they are numbered and the wastes are placed below the corresponding process step and the improvements are placed above the corresponding process step)
Waste is any activity that consumes resources but does not create any value for the client.
Examples of waste:
- Walking to the other end of the office to get a file
- Creating errors that require rework
- Using both electronic files and paper files
- Producing more items than needed or before they are needed
Now that you have completed your process map you should have a good handle of the current process steps, have identified the wastes in the current set up, and have many improvement ideas to eliminate or reduce the impact of these wastes.
Not all improvement ideas are equal so it is now time to prioritise them. I will tell you all about how to do this in Part 2, which is coming soon.


